 THE NERC MST RADAR FACILITY AT ABERYSTWYTH
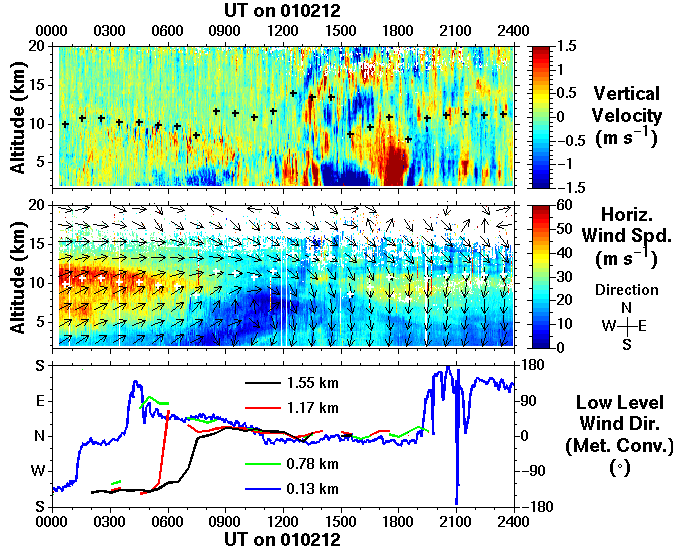
Except in cases of convection or short horizontal wavelength gravity wave activity, (absolute) atmospheric vertical velocities tend to be of the order of only a few cm s-1. This is within the margin of error of the radar measurements and so it is only in the case of at least moderate vertical velocity activity, i.e. of the order of a few 10's of cm s-1 or greater, that the measurements can be considered to be representative of actual atmospheric motion. Vertical velocities measured by the NERC MST Radar tend, as in this case, to be dominated by mountain lee wave activity. The strongest wave actvity is expected when the low-level wind is from between the North and South through East, i.e. from the directions in which the mountains are situated.
The lowest panel in the figure above shows the low-level wind direction (in the meteorological convention, i.e. the direction FROM WHICH the wind is blowing) measured at (blue line) `surface level', i.e. by the wind tower at Frongoch, and at altitudes of (green) 0.78 km, (red) 1.17 km and (black) 1.55 km measured by the 915 MHz Met Office boundary-layer wind-profiler which was operated at the NERC MST Radar site between 1999 and 2002. The boundary-layer wind-profiler data (at 30 minute intervals) are particularly patchy prior to 0500 UT and after 2000 UT; the surface data (at 1 minute intervals) have been smoothed by a 10 minute running mean. As can be seen between 0900 and 1800 UT, the horizontal wind vector at the lowest level observed by the MST radar, i.e. around 2 km, can, in general, be taken as proxy for the low-level wind; in practice the wind vector within the lowest km or so of the atmosphere rotates approximately 20° - 30° anti-clockwise (in the Northern Hemisphere) with decreasing altitude (when viewed from above) owing to the increasing effects of frictional drag. However, prior to 0900 UT there is a marked directional shear with altitude (~180°) and so the lowest-level wind vector inferred from the MST Radar observations bears no relation to the lower-level flow. The sharp rotation of the horizontal wind vector can clearly be traced at progressively higher levels as a function of time; first at the surface level around 0100 UT, at 0.78 km around 0400 UT, at 1.17 km around 0530 UT and at 1.55 km around 0700 UT, and then up through the MST Radar observations from 2 km around 0800 UT to 7 km around 1200 UT.
In fact the changes in the lee wave activity observed by the MST Radar in this particular case have more to do with the rotations of the horizontal wind vector above 2 km than those below it. Significant mountain wave activity is apparant in the vertical velocities at the lowest levels from at least 0600 UT. The reason that the vertical propagation of the waves is restricted prior to 1230 UT appears to be the presence of critical layers, i.e. where the horizontal wind vector has rotated > 90° relative to that at the wave forcing level. It will be shown in connection with the spectral widths that this is causing the wave energy to be dissipated as turbulence.
- Internal Links:
- Return to top of page
- The Met Office's boundary-layer wind-profiler
- Surface wind measurements from Frongoch
- The NERC MST Radar
- Wind vector determination by the Doppler beam swinging technique
- Wind vector notation conventions
- Horizontal wind
- Radar return signal power
- Aspect sensitivity
- Spectral width
- The Met Office's boundary-layer wind-profiler