THE NERC MST RADAR FACILITY AT ABERYSTWYTH
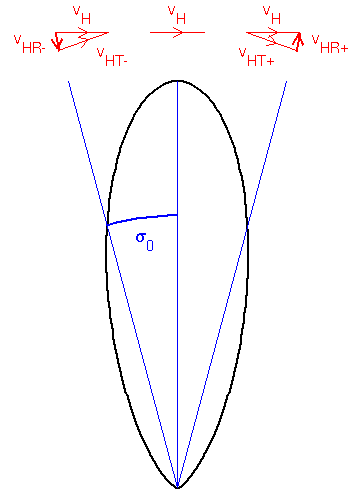
Wind-profiler radar return signals are Doppler shifted according to the radial component of the wind, i.e. that along the beam pointing direction; the transverse component of the wind has no effect. The radar return signals for a vertically directed beam might therefore be expected to be influenced only by the vertical component of the wind. However, owing to the fact that radar beams have finite widths, the horizontal wind, vH, actually has a small effect. As can be seen from the diagram, it is only for the very centre of the beam that the horizontal wind has only a transverse component, vHT; the magnitude of the radial component, vHR = vHsinθ, increases with increasing angle from zenith, θ, and the sign depends on whether it is the side of the beam facing into or away from the horizontal wind. This leads to the radar return signal power being spread across a range of Doppler velocities, an effect known as beam-broadening, with the mean Doppler shift corresponding to the mean vertical velocity. Additional broadening can occur if the vertical velocity fluctuates as a result of turbulent motions. In principle, therefore, the intensity of the turbulence can be derived from the radar return spectral widths after correcting for the effects of beam-broadening.
Since the (two-way) polar diagram of a vertically directed radar beam has a Gaussian form:
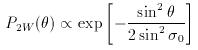
where the standard deviation σ0 represents the beam-width, the spread of Doppler velocities, vD, as a result of beam-broadening will also have a Gaussian form centred about the mean vertical velocity:
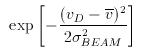
where the standard deviation &sigmaBEAM is given by:
The spread of velocities caused by turbulent activity will also have a Gaussian distribution about the mean vertical velocity, with a standard deviation σTURB which gives a measure of the turbulence intensity, and so the standard deviation of the combined distributions, i.e. the spectral width of the radar return signal, σSW, is given by:
Note that the spectral widths in the old format files of NERC MST Radar data are defined in a non-standard way; the values must therefore be multiplied by a scaling factor of 1.25 (explained in the file format page) before the following correction can be applied. The variance of vertical velocity variations caused by turbulence can therefore (in principle) be extracted from the observed spectral widths through the relationship:
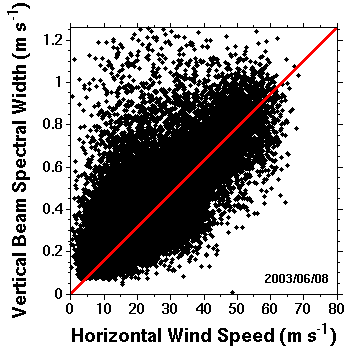
The diagram below shows a scatter plot of observed vertical beam spectral widths as a function of horizontal wind speed for 24 hour's worth of observations made by the NERC MST radar. The red line corresponds to vHsinσ0, i.e. σBEAM, where sin2σ0 = 2.47 × 10⁻⁴, which corresponds to a one-way half-power half-width of 1.5°. It should be noted that beam broadening corrected values of spectral can only be extracted for points lying above the line. Moreover, attention should confined to those points which lie significantly above the line. Since the beam broadening contribution to the observed spectral width increases with increasing wind speed, the liklihood of being able to extract turbulence information decreases with increasing wind speed.