 THE NERC MST RADAR FACILITY AT ABERYSTWYTH
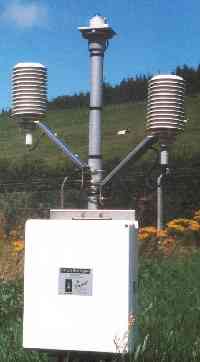
Data are recorded with a (Met Office approved) CR10 "Climate Data Logger" from Campbell Scientific using the following sensors:
- Temperature
- Campbell Scientific 107 thermistor temperature probe mounted inside a URS1 unaspirated radiation shield. Accuracy: +/- 0.4 °C.
- Pressure
- Vaisala PTB101B barometric pressure sensor. Accuracy: +/- 2.0 hPa.
- Relative humidity
- (Vaisala) HMP45C temperature and relative humidity probe (from which only the humidity measurements are used) mounted inside a URS1 unaspirated radiation shield. Accuracy: +/- 0.3%.
- Rainfall
- (Environmental Measurements) ARG100 tipping bucket raingauge. Note that occasional build-up of fungus within the inlet tube can impede or even completely inhibit the flow of rain into the instrument. This makes the rain data the least reliable of the surface meteorological measurements.
- Downwelling shortwave radiation
- (Kipp and Zonen) CM3 thermopile pyranometer (WMO second class). Accuracy: +/- 0.5%.
The data logger initially samples the atmospheric temperature, pressure and humidity sensors at 5 s intervals. Mean values are calculated over each 60 s and the outputs from the logger represent minima, means and maxima of these 60 s means over each 10 minute sample period.
The data logger initially samples the tipping bucket raingauge every 1 s and records a tip for each 0.20 mm accumulation of rain. The output from the logger represents the total accumulation of rain over the each 10 minute sample period.
The data logger initially samples the pyranometer every 5 s and records the downwelling radiation (within a hemispheric field of view) with a flat response in the spectral range 305 - 2800 nm. The output from the logger represents the accumulation of energy per unit area within each 10 minute sample period. The measured radiation is compared with that predicted for the logger's latitude and longitude, and for the time of year and the time of day (assuming clear sky conditions). A sunshine priod is defined as one in which the ratio excedes 0.4 and the output from the logger represents the accumulated sunshine duration within each 10 minute sample period. Note that this is an estimated product, which is not derived according to the WMO definition of sunshine duration.
The data logger records the instantaneous battery voltage and internal temperature at the end of each 10 minute sample period for performance checking purposes.