THE NERC MST RADAR FACILITY AT ABERYSTWYTH
The Vaisala Weather Transmitter WXT510 is a single unit which measures a variety of surface meteorological parameters in three independent measurement cycles. Pressure, temperature and relative humidity (ptu) are measured in the first cycle, precipitation (precip) in the second, and wind speed and direction (wind) in the third. The data (for a given day) from each of these cycles are stored in separate files with respective names of the format:
nerc-mstrf-met-sensors_capel-dewi_YYYYMMDD_wxt510-ptu.nc
nerc-mstrf-met-sensors_capel-dewi_YYYYMMDD_wxt510-precip.nc
nerc-mstrf-wind-sensors_capel-dewi_YYYYMMDD_wxt510.nc
where YYYYMMDD is an 8-character string representing the date. Missing data values are used to indicate gaps in data collection.
Pressure is measured by a silicon BAROCAP (R) sensor, temperature by a capacitive ceramic THERMOCAP (R) sensor, and relative humidity by a capacitive thin film polymer HUMICAP (R) 180 sensor. These are simultaneously sampled at 60 s intervals.
Precipitation is measured by a RAINCAP (R) piezoelectric sensor, which has an area of 60 cm2. The signal generated by the impact of a single raindrop is proportional to its volume. Internal signal processing is used to differentiate between the signals generated by rain, hail and undesired sources. Nevertheless, occasional small rain accumulations appear to be unrelated to precipitation. Data messages are only generated for the duration of a precipitation event, when they are available at 10 s intervals. The rainfall and hail accumulations represent the amounts since the last non-zero readings. The rates represents the mean values over the preceding 60 s. Within the first 60 s of a precipitation event, the rates are evaluated only over the period since the start time of the event.
Wind speed and direction are measured by a WINDCAP (R) sensor. This consists of an array of three equally-spaced ultrasonic transducers (approximately 11 cm apart) in a horizontal plane. The time it takes for sound to travel between each pair of transducers depends on the temperature and the humidity of the air and on the component of wind vector along the direction joining the transducers. For a given pair of transducers, the effects of temperature and humidity are the same for the sound travelling in both the forward and the reverse directions. However, the effects of the wind vector are opposite. Measurements are required between at least two pairs of non-collinear transducers in order to derive the wind speed and direction. The use of measurements from all three pairs of transducers provides redundancy, which allows the wind information to be derived from the two pairs of transducers which provide the best quality signals. No attempt is made to calculate the wind direction when the speed drops below 0.05 m s-1. Instead, the last calculated direction is used until the wind speed rises back above 0.05 m s-1. Samples of wind speed and direction are taken 4 times a second over 3 seconds. From these 12 samples, the minimum, mean, and maximum values of speed and direction are recorded.
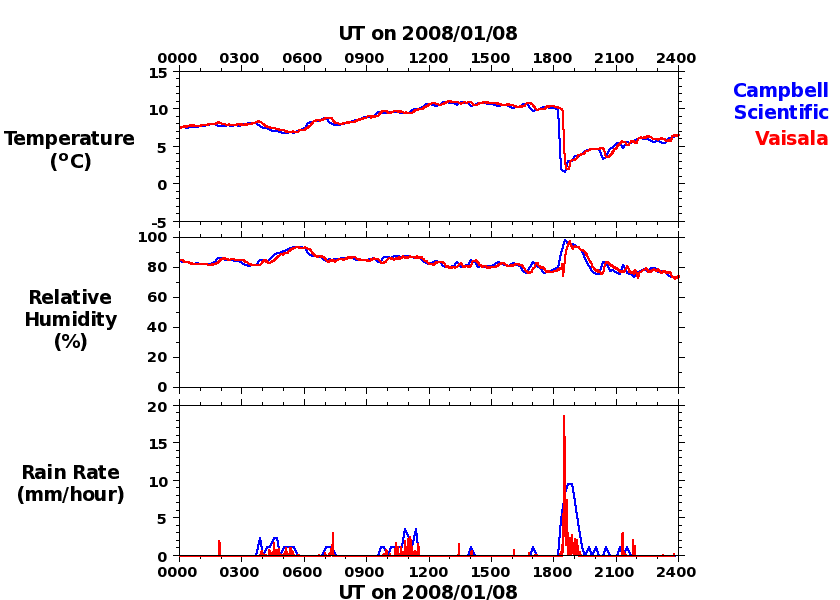
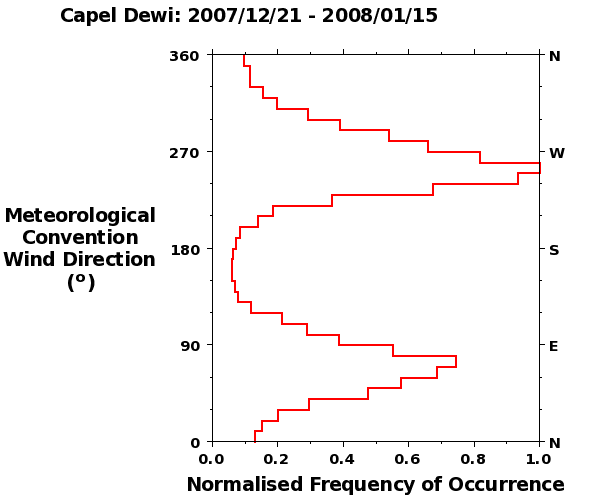
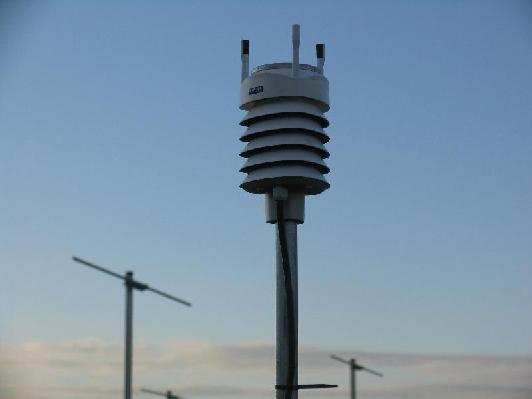
The instrument at the NERC MST Radar site is mounted on a pole at approximately 1.9 m above ground level and at approximately 15 m to the north of the site bungalow. Messages are recorded by a Network Time Protocol enabled data logging computer together with the time (to the nearest second) at which they arrived. Measurements of pressure, temperature and relative humidity are generally in good agreement with those from the Campbell Scientific climate data logger, which is located approximately 50 m further north - see below. Although the rain rates show similar patterns to those measured by a tipping bucket raingauge, the values from the WXT510 tend to have larger peak values and to be more variable as a function of time. This is consistent with the fact that the rates are evaluated over 1 rather than 10 minutes. The radar site is located within an approximately ENE-WSW aligned valley which leads to a strongly bimodal distribution of wind directions. Consequently the wind information cannot be interpreted to be representative of the larger-scale low-level flow - see below The wind data from the 10 m tower at Frongoch farm, which is located 3 km to the west, are recommended for this purpose.
Data are available from 21st December 2007 until the present.